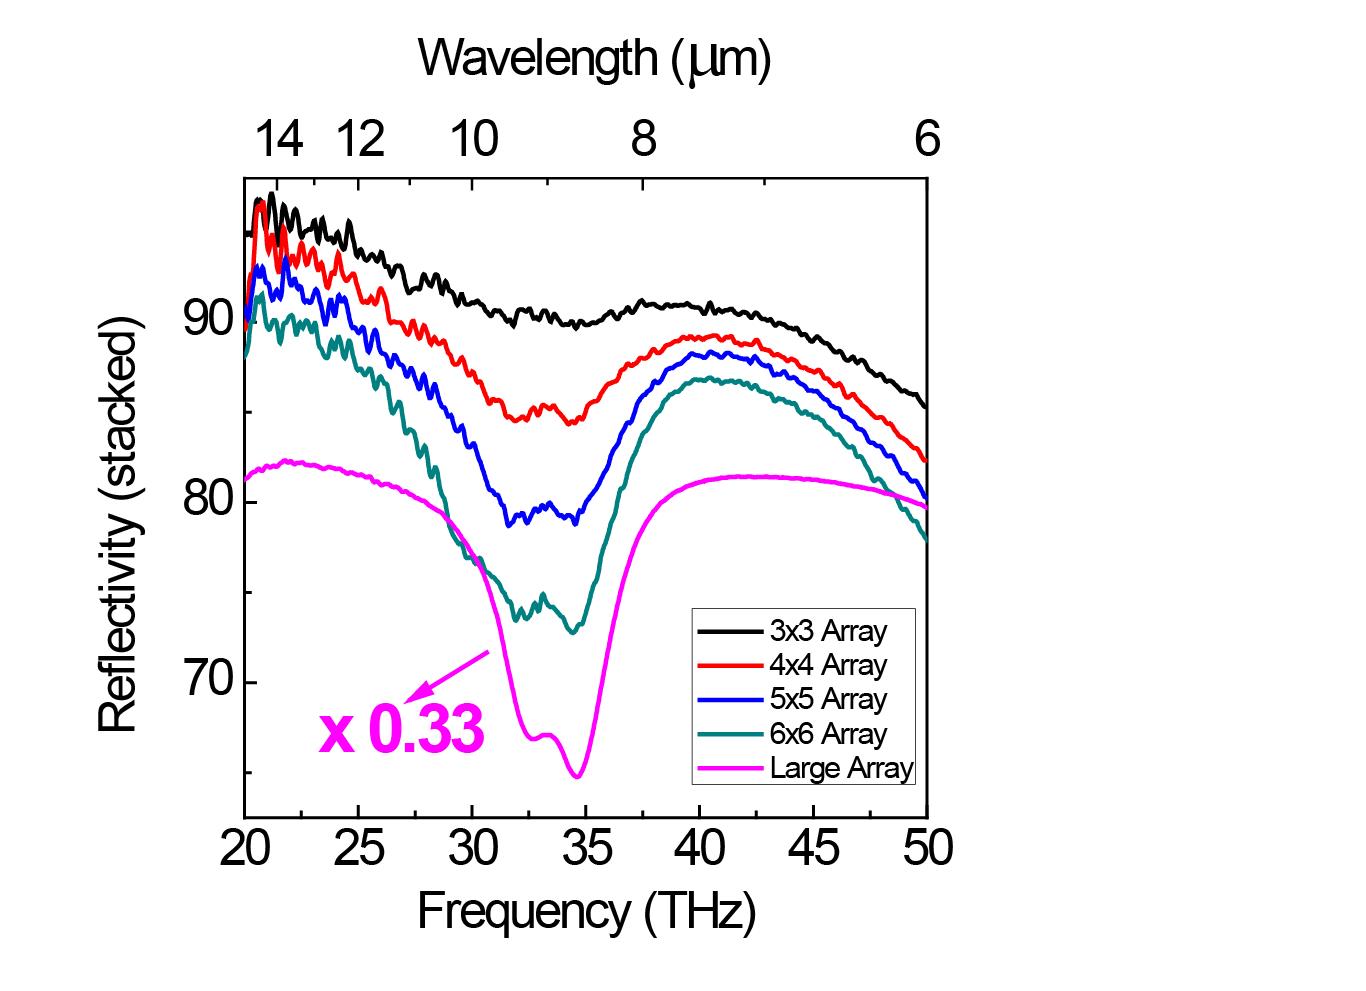
Reflectivity spectra of a sample
Reflectivity spectra of a sample where an intersubband excitation in a doped quantum well couples with the fundamental mode of a metallic nano-antenna. The emergence of upper and lower polariton states is evidence of the strong coupling regime. We can observe polaritonic states down to an array containing only 16 nano-antennas (thick red solid line).
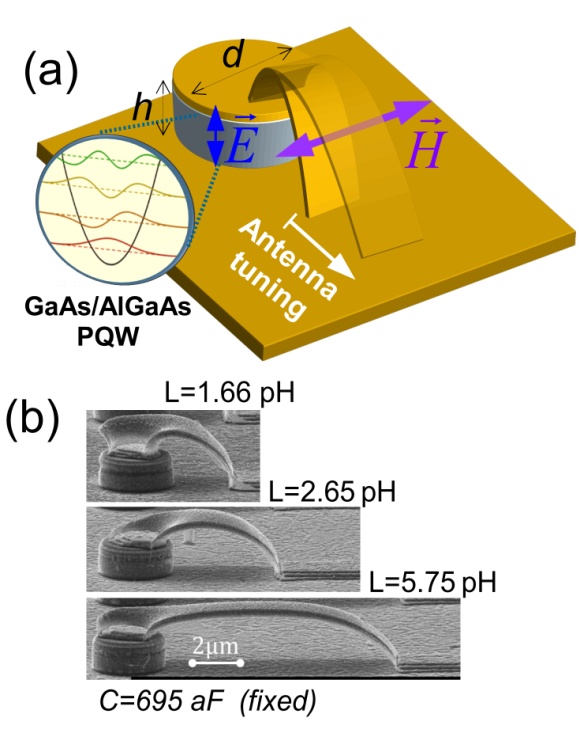
Diagram of a lithographically tunable LC resonator
(a) Schematic diagram of alithographically tunable LC resonator with an embedded parabolic quantum well. The electric and magnetic dipoles excited by the incoming radiation are shown.
(b) The real devices: scanning electron microscope pictures of three LC resonators with different antenna lengths. The top and bottom pictures are the extreme antenna lengths of the overall set, and correspond to the highest and lowest resonator frequencies explored.
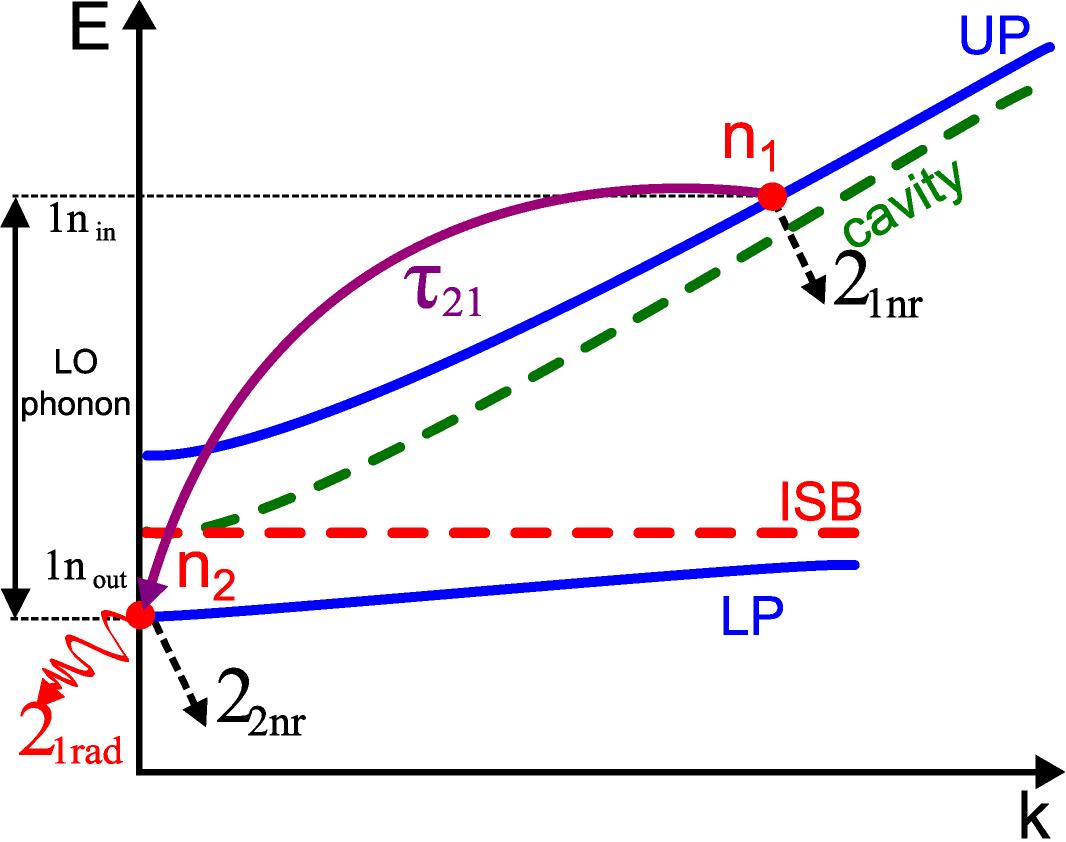
Typical dispersion diagram
Typical dispersion diagram of intersubband polaritons in a metal-dielectric-metal cavity. The various loss channels are represented as well as the scattering mechanism based on the longitudinal optical phonon, which is relevant for the operation of a bosonic laser. The solid lines represent the two polariton eigenmodes, and the dashed lines are the bare cavity and ISB eigenstates.

Optimal intersubband polariton-dispersion diagram
Optimal intersubband polariton-dispersion diagram for an optical pumping experiment. The minimum Rabi splitting occurs at k=0, and light is resonantly injected at an angle of 20°, one LO-phonon away from the lower state minimum energy. The sample considered in this simulation consists of InGaAs/AlInAs QWs doped to a sheet-doping density of 1.3 × 1012 cm-2. The grating period is 3.25 μm.
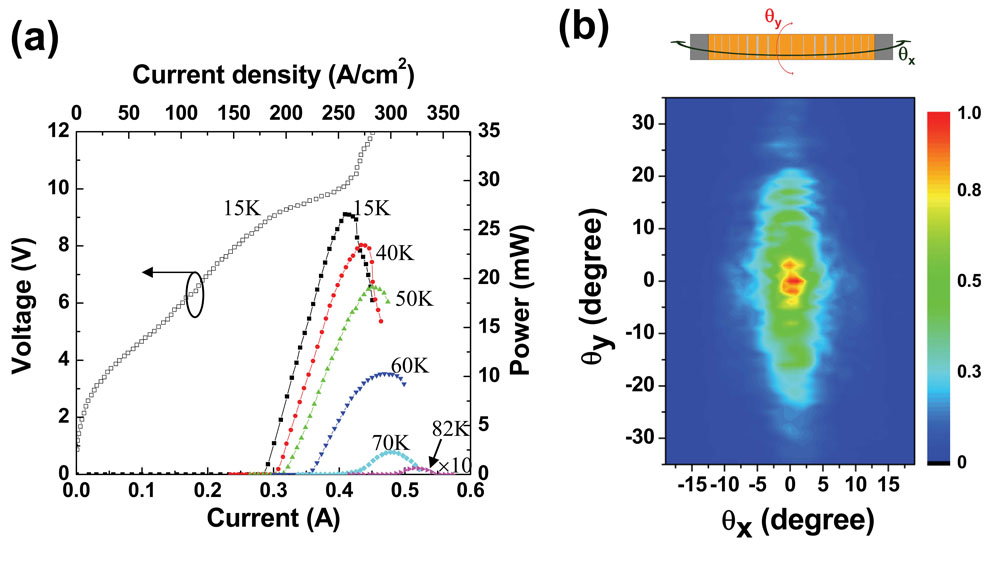
Typical periodicity-graded GPH surface-emitting THz laser
(a) Light-current-voltage (L-I-V) characteristics of a typical periodicity-graded GPH surface-emitting THz laser measured at different heat-sink temperatures. The device was operated with 25 ms-long pulses, at a frequency of 20 Hz. The device dimensions are 130 x 1180 μm2.
(b) Far-field emission pattern of the same device acquired at a heat-sink temperature of 40 K. The injected current is about 1.1 times the threshold to ensure single mode emission.
The measurement is performed by scanning a Golay cell on a spherical surface at a constant distance of 15 cm from the sample surface.